The COVID-19 pandemic has had an unprecedented impact on public health, economies, and governance worldwide. However, mortality rates have varied significantly from country to country, indicating that the effects of the virus are not solely biological but also influenced by societal structures. This study identifies five key aspects that play a crucial role in determining the death rate due to COVID-19: economy, corruption, education, health, and government regime. By analyzing these factors, we can better understand how different nations have responded to the pandemic and why some have faced higher mortality rates than others.

- Economic: Do richer countries perform better against the virus than emerging ones?
- Corruption: Do the most corrupt countries have more deaths?
- Health: Are countries with the most investments in health coping better with the pandemic?
- Education: Does the quality of education interfere with the death rate?
- Government: Is democracy more prepared to save lives than authoritarian regimes?
1) ECONOMY
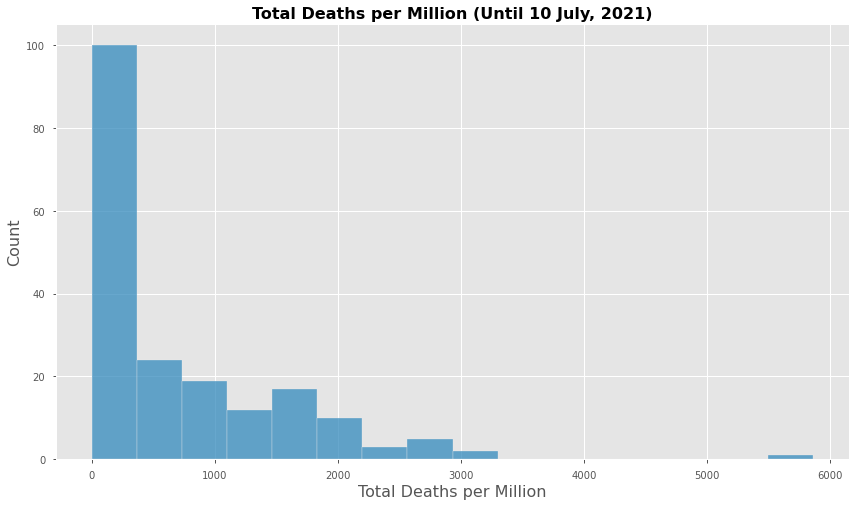
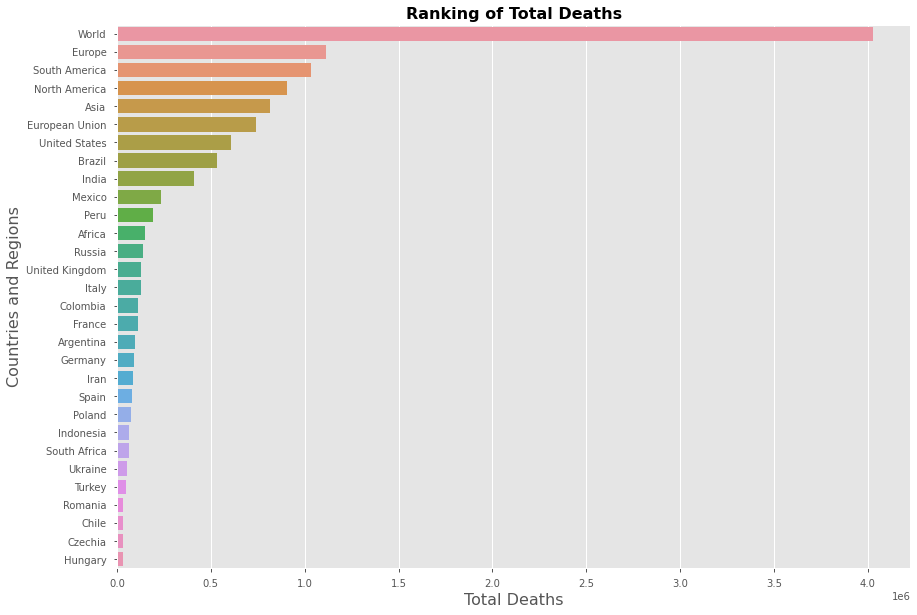
Unfortunately, the world has surpassed four million deaths due to Covid-19. The disease has affected everyone, from the most impoverished countries to the few that concentrate most of the world’s wealth. The majority of countries have recorded fewer than 1,000 deaths per million (Graph 1, above). So far, the correlation between economic development and mortality rate remains weak, as shown below (Graph 2).
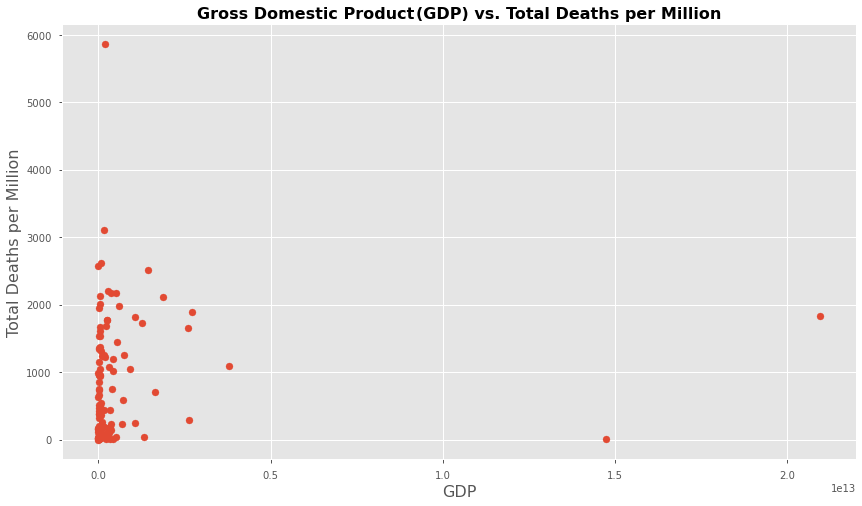
According to Graph 2 (above), deaths per million are not influenced by GDP. A strong correlation would be observed if, for instance, the number of deaths consistently increased or decreased as GDP rose. However, as we can see, most countries are classified as poor, yet as GDP increases, the number of deaths per million varies significantly.
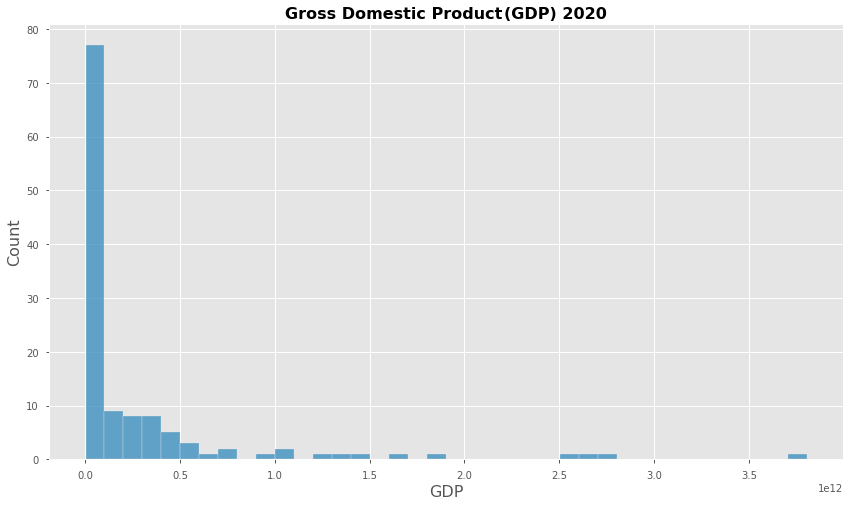
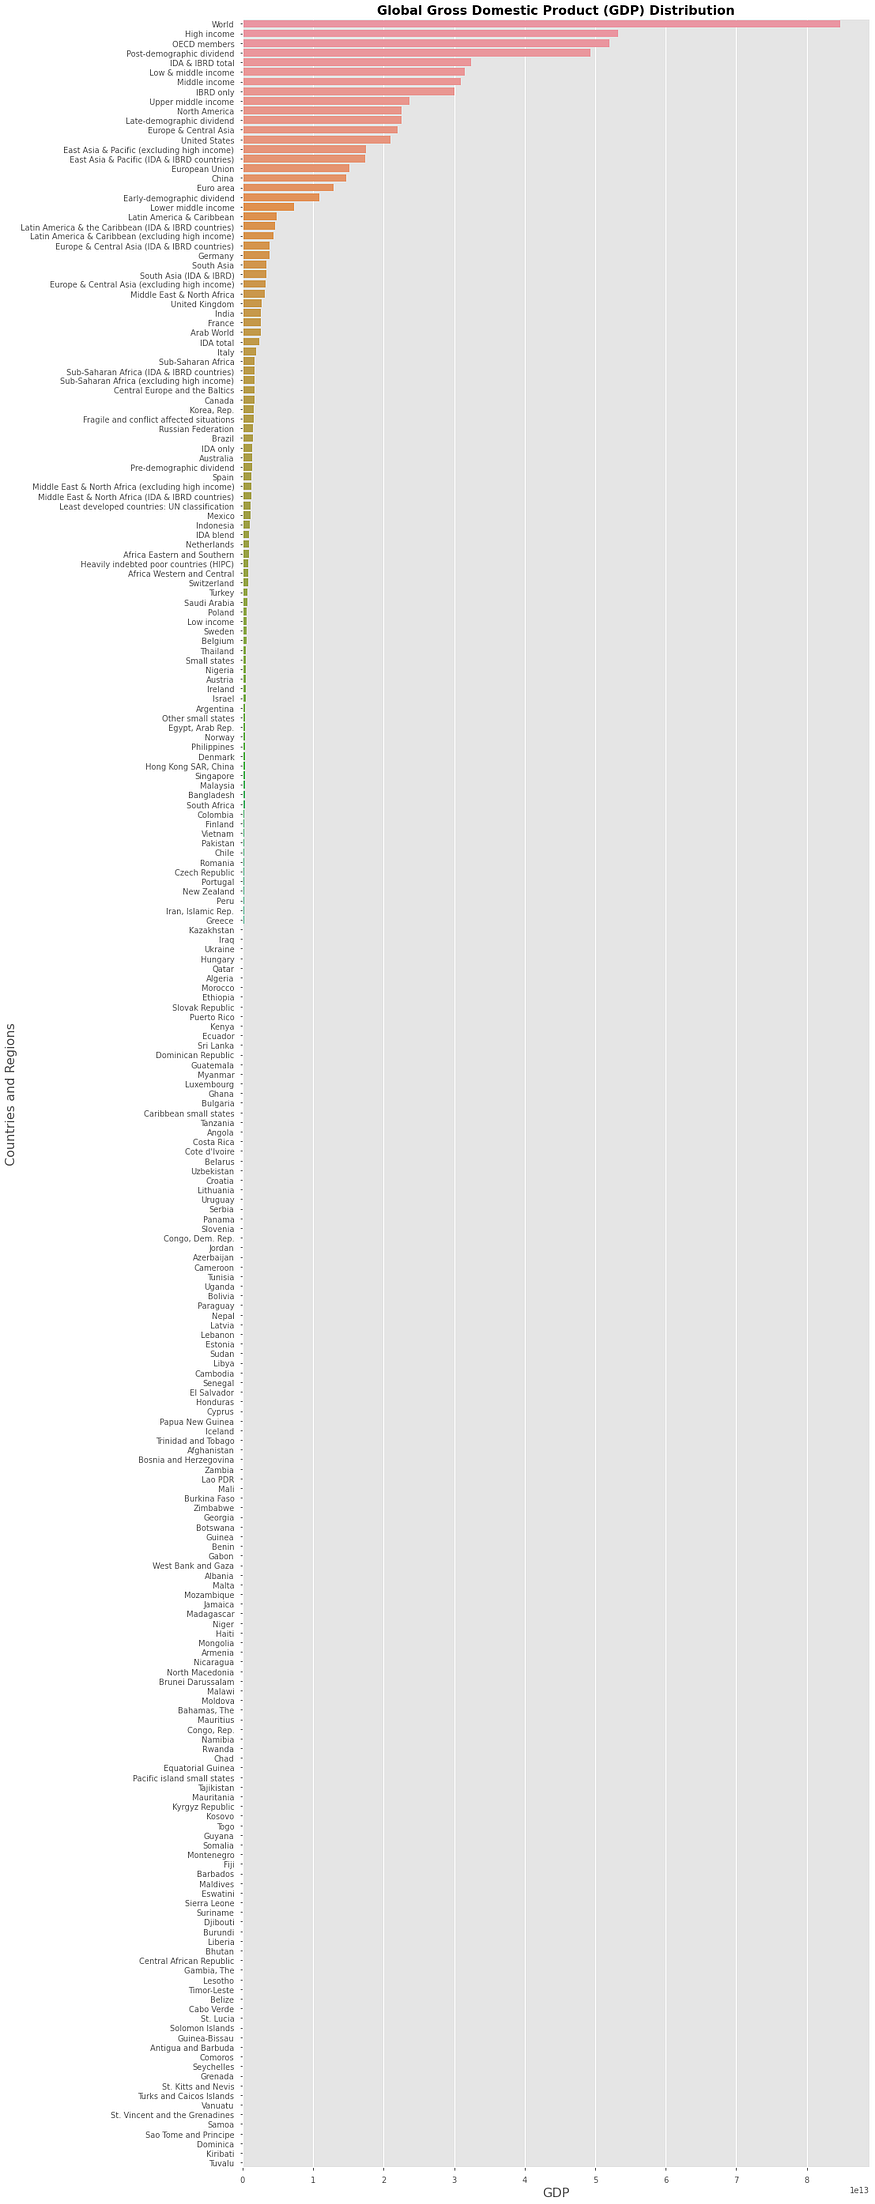
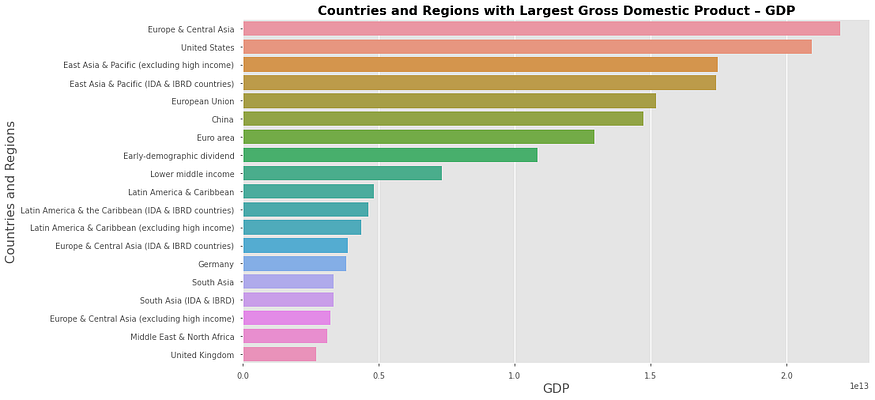
However, the higher concentration of deaths in countries with the lowest GDP does not necessarily imply that the poorest populations are the most severely affected. Rather, it primarily reflects the broader global distribution of wealth. Below, Graph 4 presents a comprehensive overview of world GDP, illustrating its distribution across countries and continents.
Based on total deaths per million from COVID-19 (according to the “Our World in Data” dataset) and global GDP in 2020 (as reported by the World Bank), emerging countries were not the most affected by the virus at the start of the pandemic. However, the correlation between economic indicators and mortality rates began to strengthen in 2021, surpassing the trends observed in the previous year, despite being only halfway through the year.
This shift is largely due to the substantial investments made by the most developed countries in vaccines, medical equipment, treatments, hospitals, and other healthcare measures. As a result, the influence of economic indicators on mortality rates may soon become even more evident.
In 2020, the novel coronavirus had a severe impact on developed countries, primarily due to a lack of information about the disease or poor decision-making. However, last year was highly atypical, as the world was still learning how to respond to the crisis. Therefore, by the end of this year, the trends are expected to change significantly. While economic factors initially showed a weak correlation with COVID-19 deaths, they now appear to be playing a crucial role in preventing fatalities in 2021 and beyond.
Additionally, we are witnessing an increase in mortality rates among emerging countries. If wealthier nations fail to support the most impoverished, the crisis will persist. The virus is a global problem, and true safety will only be achieved when the disease is fully eradicated.
2) CORRUPTION
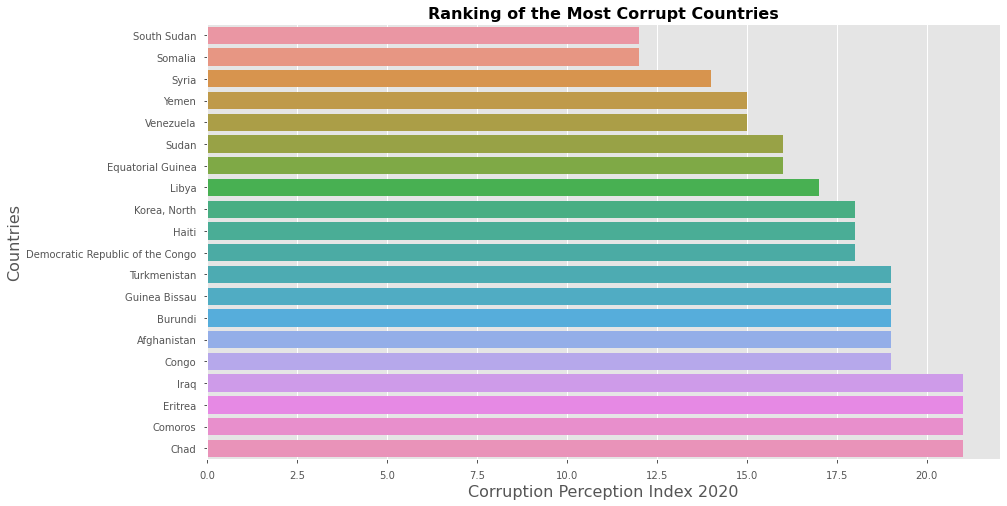
The Corruption Perception Index (CPI) ranks countries based on perceived corruption levels, with the highest-ranked being the least corrupt (e.g., Denmark, New Zealand, Finland) and the lowest-ranked being the most corrupt (e.g., Somalia, South Sudan).
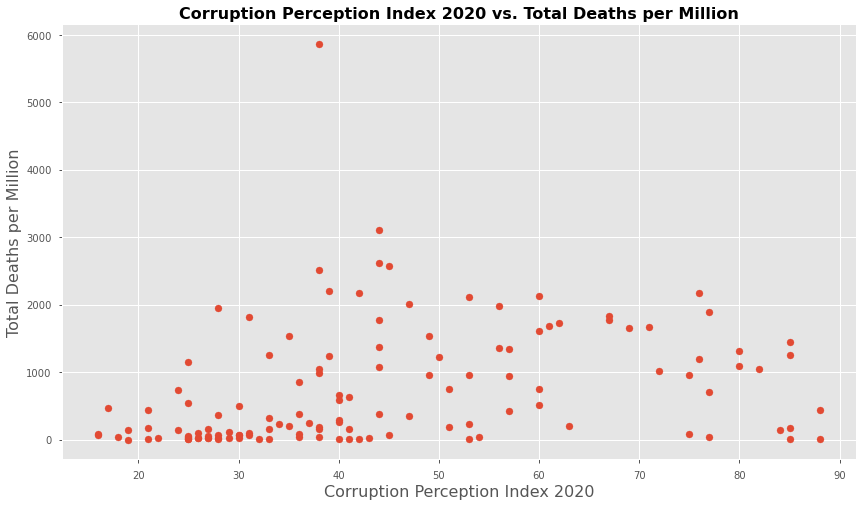
To analyze the relationship between corruption and mortality rates, countries with similar characteristics were divided into three groups. This approach made it possible to demonstrate, in the “Conclusion” section, that the most corrupt countries (Group 1) reported fewer deaths. Similarly, although the data in the dispersion plot above (Graph 6) is highly scattered, there is a slight concentration of more corrupt countries with lower death rates within the 25–45 range. This is the same range in which the highest number of corrupt countries appears, as illustrated in Graph 7 (below).
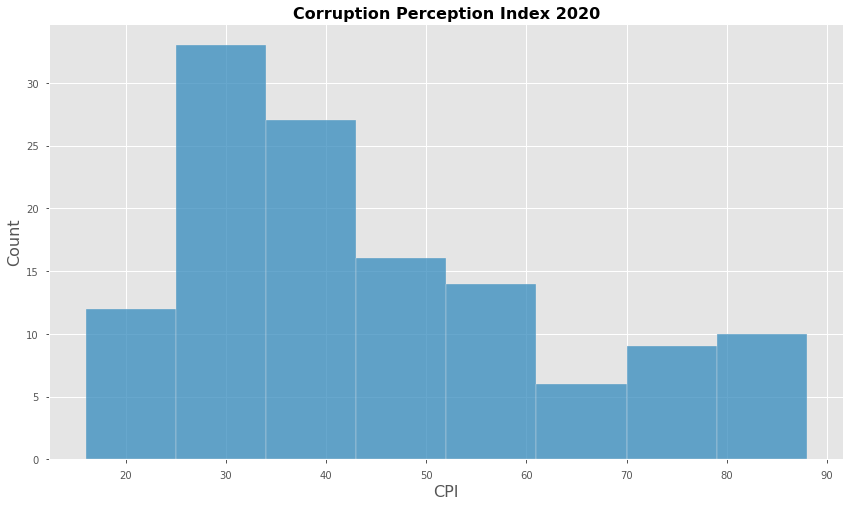
It is evident that a higher number of countries fall within the high-corruption range (between 25 and 45 on the CPI scale), and most of them report fewer deaths. Does this imply that corruption is linked to lower mortality rates? At first glance, it might seem so. However, corruption is intrinsically connected to three other key factors that have a stronger influence on mortality: healthcare, education, and democracy.
The Corruption Perception Index (CPI) ranks countries based on perceived corruption levels, with the highest-ranked being the least corrupt (e.g., Denmark, New Zealand, Finland) and the lowest-ranked being the most corrupt (e.g., Somalia, South Sudan).

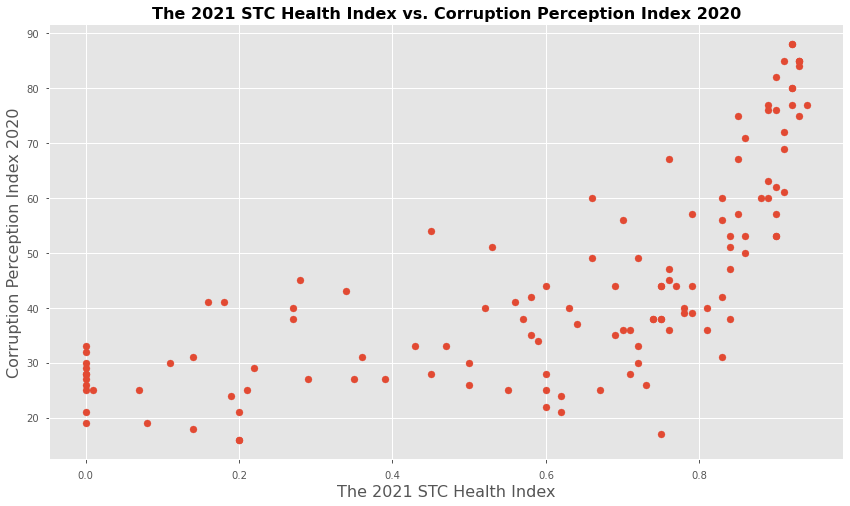
The higher the level of corruption in a country, the worse its healthcare, education, and democracy tend to be, as shown in Graphs 10, 11, and 12 (below). There is a strong correlation between these three indicators and corruption. As the CPI score increases, improvements in health, education, and democracy become evident.
Therefore, although corruption may not appear directly linked to mortality rates due to the dispersion seen in Graph 6 (“Corruption Perception Index 2020 vs. Total Deaths per Million”), it is indirectly associated with death rates through its impact on these critical factors.


3) HEALTH
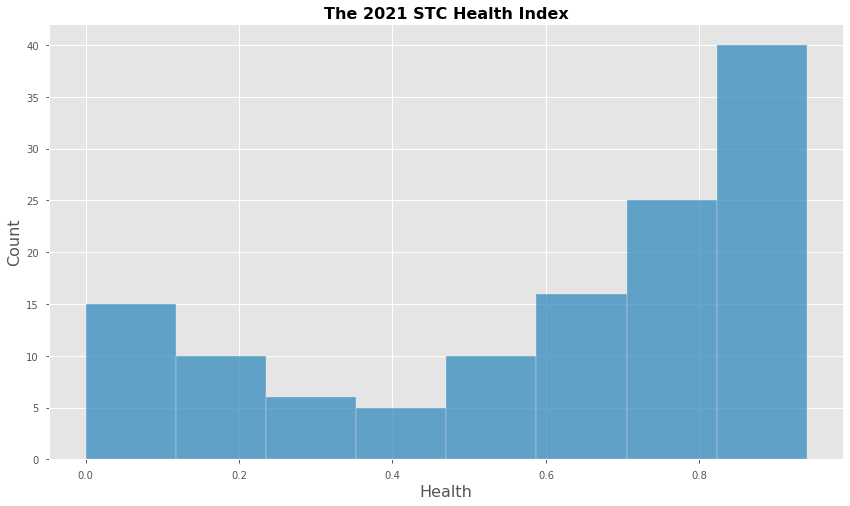
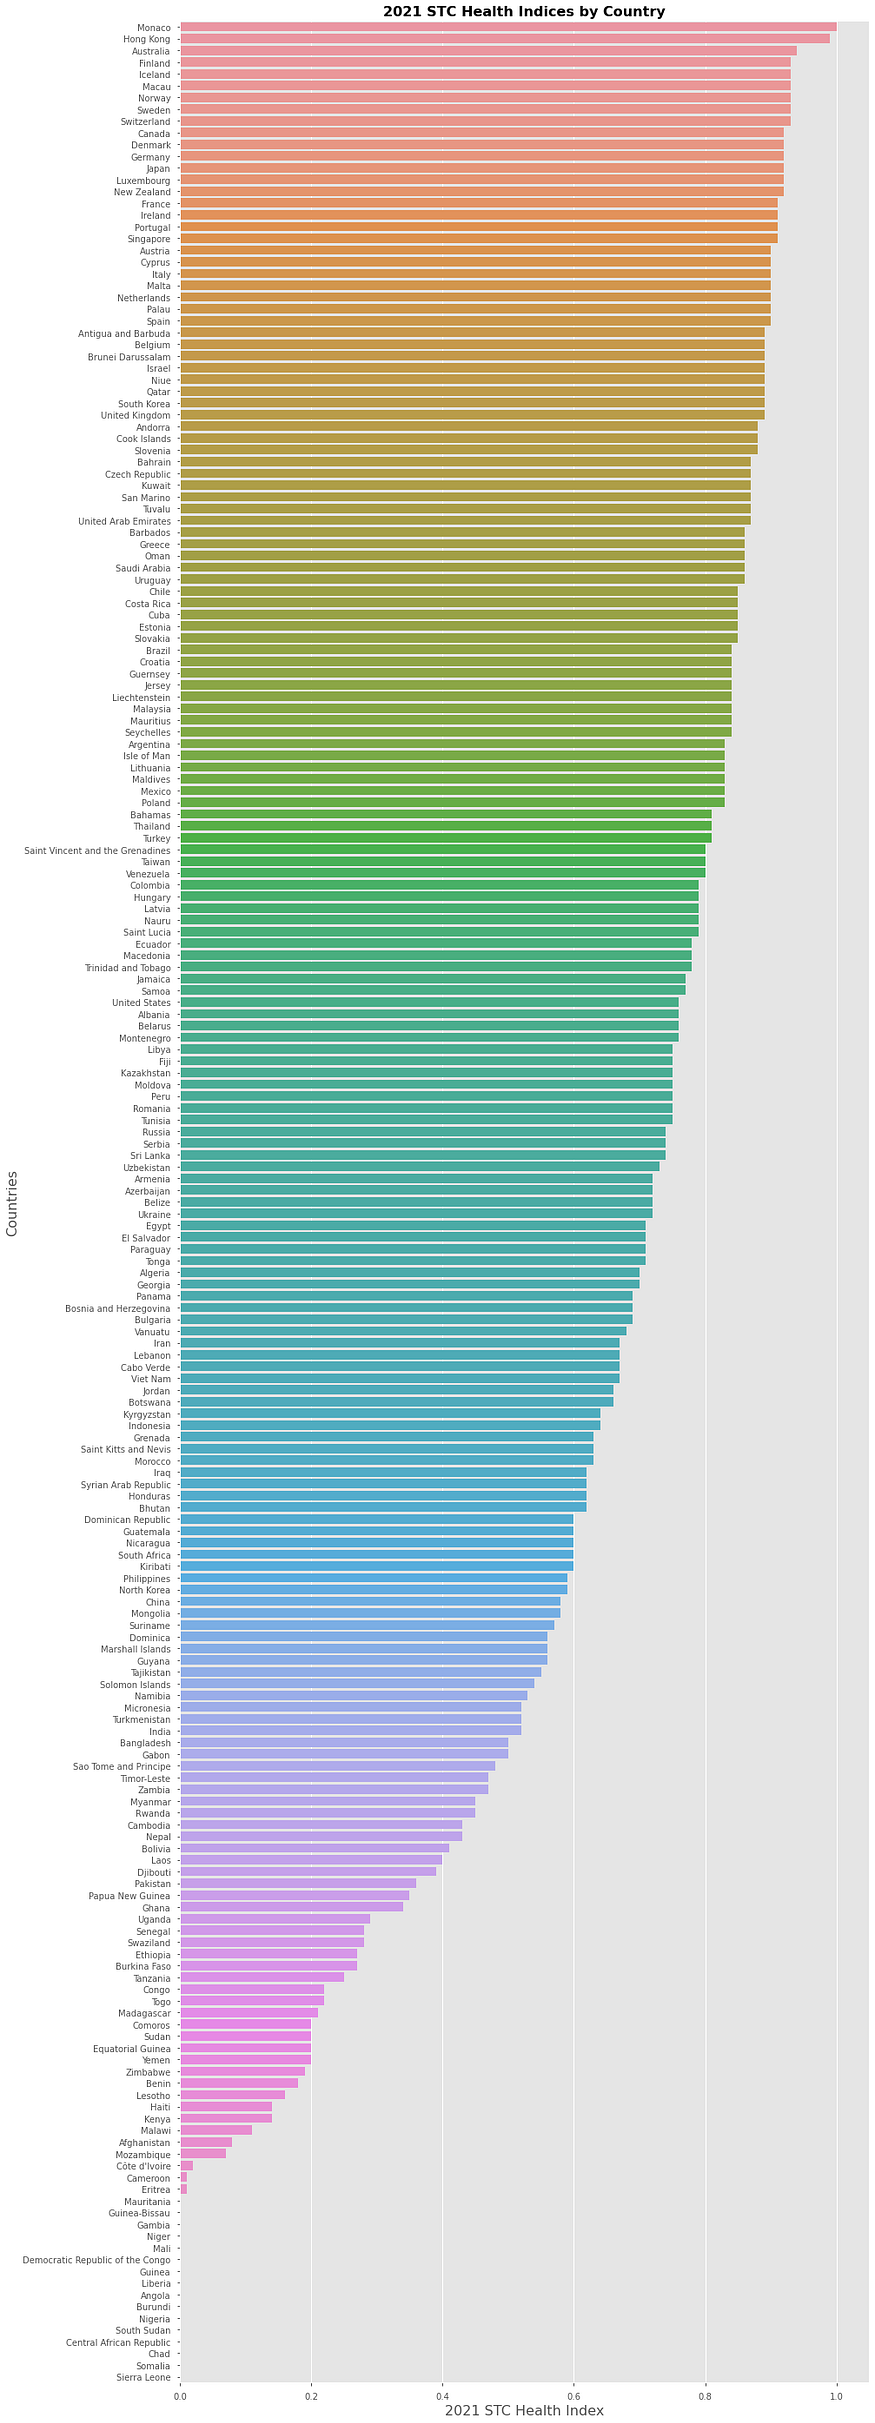
Among the five aspects analyzed, healthcare is one of the most strongly correlated indicators of mortality rates. This correlation is expected to strengthen further this year as global vaccination efforts continue. The disparity between countries that invest heavily in healthcare and those that lack the same resources will become even more pronounced.
To analyze the correlations between the variables in this study, we used Spearman’s rank correlation coefficient, as it is suitable for data that exhibit non-linear behavior. Below, we present the rounded correlation values for each analyzed aspect in relation to the death rate (on a scale from 0 to 1, where 1 indicates the strongest correlation):
- GDP: 0.39
- Corruption: 0.45
- Democracy: 0.55
- Health: 0.59
- Education: 0.60
Over the total period analyzed, healthcare shows a strong correlation with mortality, with a coefficient of 0.59. Last year, the coefficient was 0.61. This year, it stands at 0.50, but the trend suggests that this indicator will increase significantly throughout 2021.
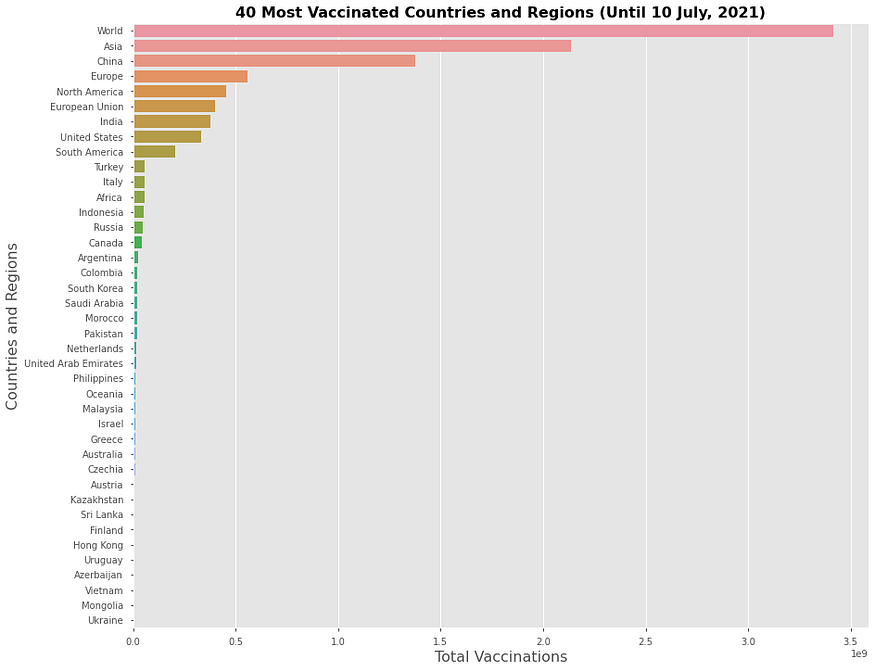
We are now in mid-2021. Vaccination in most developed countries began in January of this year, coinciding with a period of high mortality in these nations due to infections contracted at the end of 2020. However, the greatest challenge now lies in countries with limited healthcare investment. If no effective measures are taken to control COVID-19 in these regions, they will likely experience a surge in new cases and, consequently, an increase in mortality rates.
Developed countries must take responsibility by assisting other nations through vaccine and equipment donations. If a high number of infections persist in poorer countries, there is a risk of new virus strains emerging — potentially resistant to all currently developed vaccines — rendering global efforts ineffective. In a pandemic, nations must adopt a global perspective, as the disease is not confined by geographical borders. COVID-19 remains a global public health crisis.
4) EDUCATION
The education index used in this study was obtained from the Human Development Reports of the United Nations Development Programme. It represents the average of mean years of schooling (for adults) and expected years of schooling (for children), based on calculations from the UNESCO Institute for Statistics (2020) and other sources.
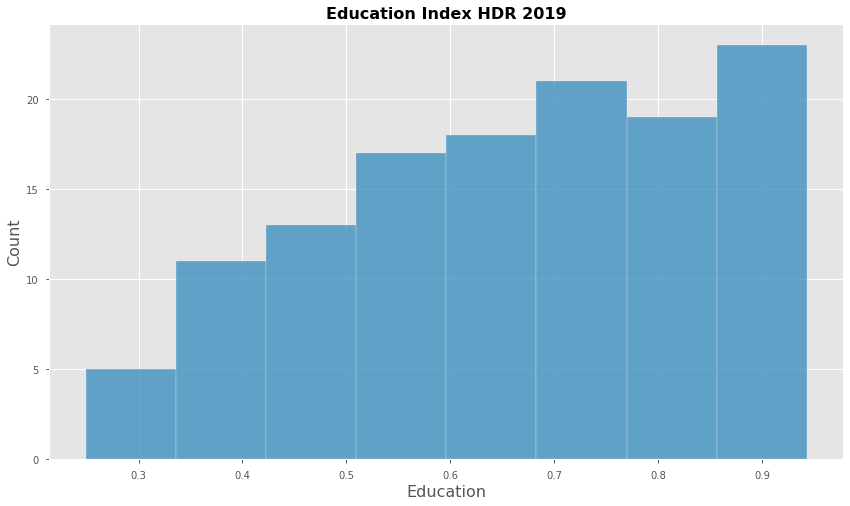
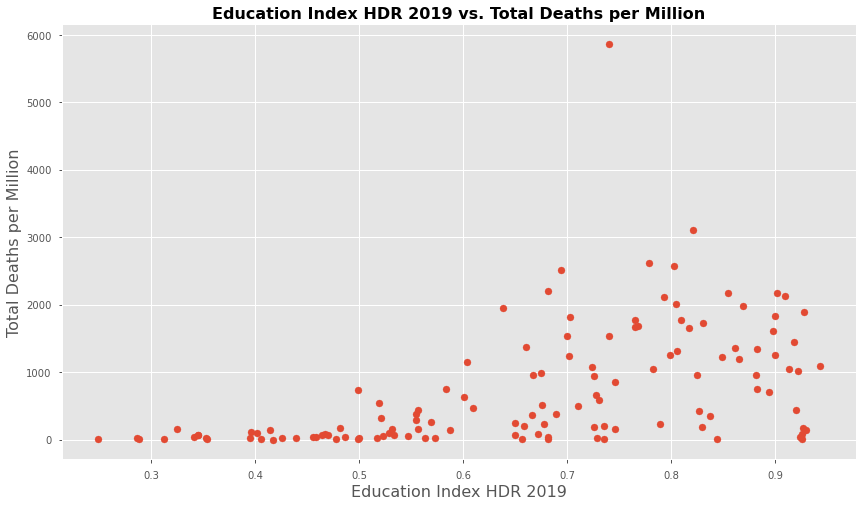
Education shows the strongest correlation with mortality rates. This is partly because, at the onset of the pandemic, countries with higher education levels experienced more deaths. One possible explanation is their cosmopolitan nature, which may have exacerbated the situation. The virus was still unknown, and the high movement of students, tourists, and workers facilitated rapid transmission.
The dispersion graph above (Graph 17) illustrates a significant increase in deaths in countries with better education. However, the trend is now shifting toward countries with lower education levels, as mortality rates in highly educated nations have stabilized, while those in less-educated countries are beginning to rise.
Education is, in fact, the most critical factor because it has the power to transform multiple aspects of society. Quality education leads to better healthcare, reduced corruption, economic growth, social equity, and much more. Unfortunately, countries like Brazil and the United States — both classified as flawed democracies — had ample time to prepare for the arrival of the virus but still lost thousands of lives due to poor political decisions. They paid an extremely high price for disregarding the fundamental principle that science must guide policy decisions.
Therefore, every country must adopt data-driven policies. This is precisely why quality education is so essential.
5) GOVERNMENT REGIME
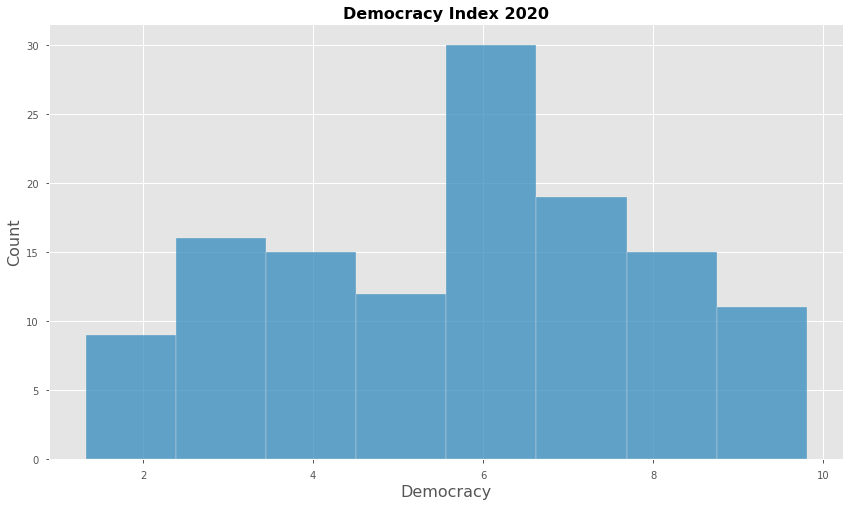
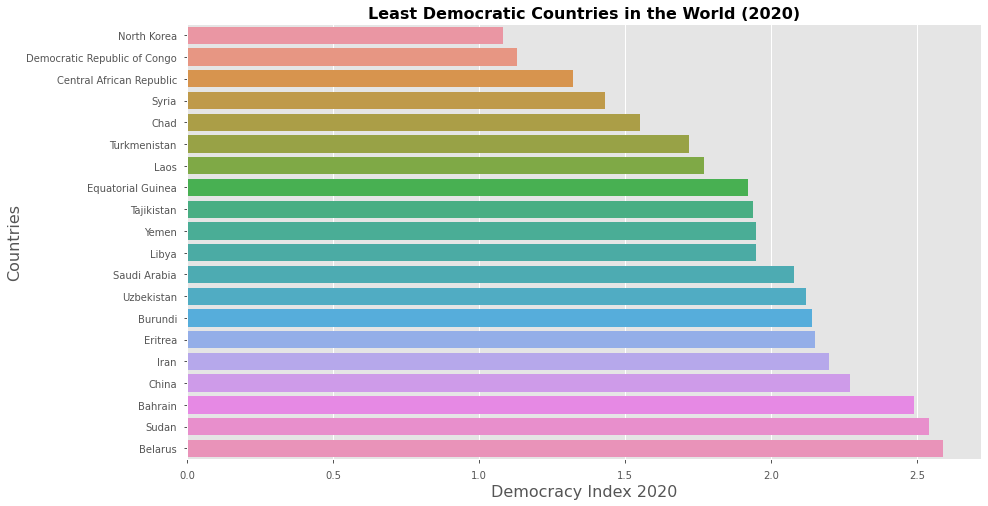
Overall, the data suggest that countries with authoritarian regimes have been more effective in controlling the virus and saving lives, even with lower levels of education and weaker healthcare systems. For instance, authoritarian countries like Venezuela have poor education and healthcare infrastructure, yet their reported COVID-19 death rates remain low. In China, where the outbreak began, the situation appears to be entirely under control.
However, it is possible that some authoritarian governments underreport mortality rates, as press freedom is often restricted in such regimes. Another explanation could be that the high level of state control over individuals in these countries allows for the strict enforcement of preventive measures, which the population is more likely to follow. Additionally, as many of these nations are relatively closed off, they may have had less exposure to imported cases of the virus.
As the democracy index increases — from authoritarian to fully democratic countries — the dispersion graph below (Graph 21) shows a gradual rise in the number of deaths. This trend becomes evident as it progresses through hybrid regimes and flawed democracies.
The most striking variations among flawed democracies are seen in the United States and Brazil, which have the highest COVID-19 death tolls in the world. Together, these two countries account for more than a quarter of all global deaths — approximately 1.14 million people. This figure surpasses the total number of deaths recorded in Europe, which stands at around 1.12 million.
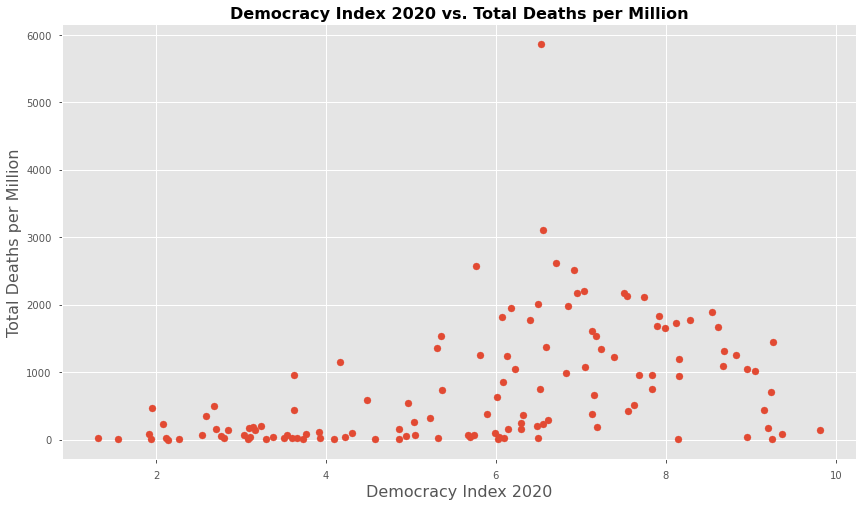
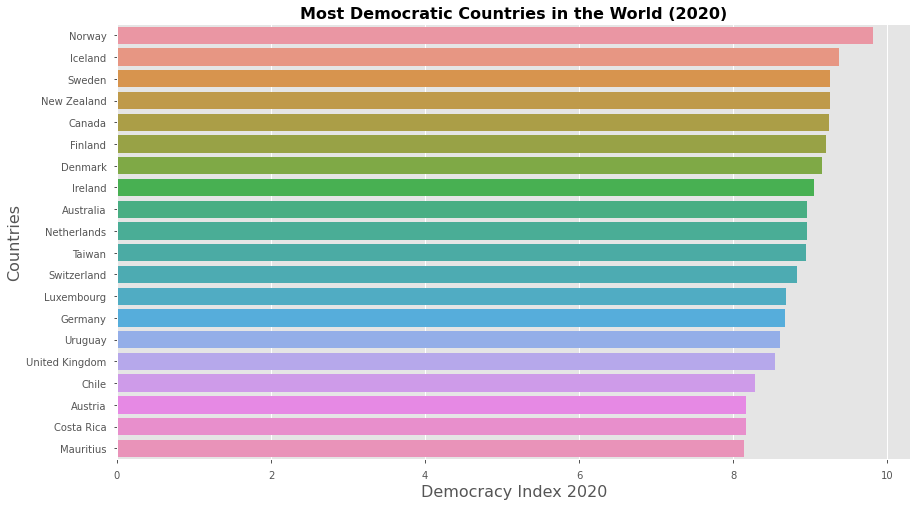
In the distribution above (Graph 21), the democracy index rises alongside the death rate, decreasing only in fully democratic countries such as Norway, Iceland, and Denmark.
Both democracy and corruption are linked to higher mortality rates. For now, mortality tends to increase as flawed democracies transition toward more democratic governance. While fully democratic countries perform better in combating the virus than flawed democracies, authoritarian regimes — such as China, Cuba, and Venezuela — continue to demonstrate the highest efficiency in controlling the outbreak.
Clustering the Countries
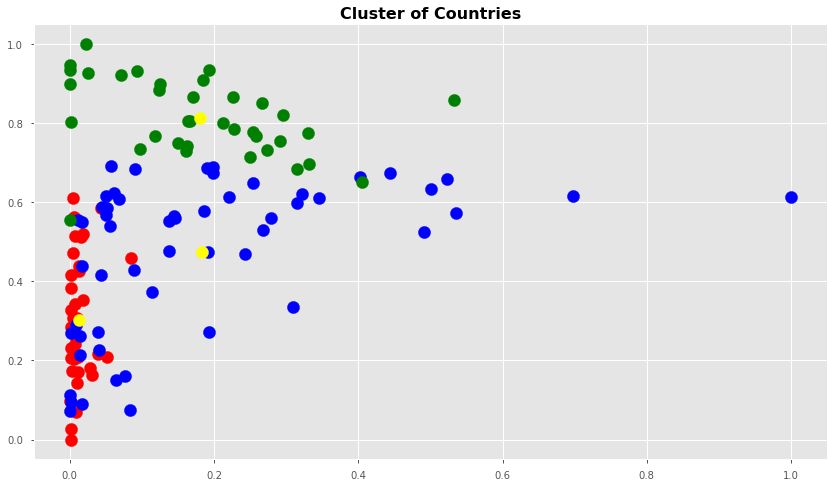
Based on their characteristics, the 127 countries analyzed were grouped into three clusters to identify factors that contribute to higher COVID-19 mortality rates. This classification was performed using the K-Means clustering algorithm, a Data Science technique.
Below (Graph 22) are the key characteristics of each group. The yellow dot represents the centroid of the cluster.
Group 1 (Red)
- 36 countries
- Mean deaths per million: 62
- Authoritarian and Hybrid Regime
- Bad health and education
- Highest corruption
- Small GDP
Group 2 (Blue)
- 55 countries
- Mean deaths per million: 954
- Flawed Democracy
- Medium/Good health and education
- High corruption
- Highest GDP (US and China)
Group 3 (Green)
- 36 countries
- Mean deaths per million: 1092
- Full democracy
- Excellent health and education
- Low corruption
- Medium/High GDP
According to the results, Group 1 — comprising authoritarian countries with lower healthcare and education levels, low GDP, and high corruption — had the lowest average number of deaths per million. In contrast, Group 3, which includes fully democratic countries, recorded the highest average mortality rate. However, Group 2, consisting of flawed democracies, reported the highest total number of COVID-19 deaths.

Conclusion
The COVID-19 pandemic has demonstrated that mortality rates are influenced by more than just the virus itself. Economic strength, corruption levels, education, public health conditions, and government regimes all interact to shape the outcomes of the crisis. These factors do not act in isolation but rather create complex dynamics that determine how effectively a country can respond to such an emergency.
For instance, a wealthy country with high corruption may struggle to allocate resources efficiently, while a nation with a strong healthcare system but low public trust may face resistance to health measures. Understanding these interconnections is essential for improving future pandemic preparedness.
To mitigate the impact of future health crises, governments should invest in healthcare infrastructure, ensure transparency and accountability, improve education systems, and adopt evidence-based policies. By addressing these structural issues, societies can build greater resilience against global pandemics and reduce mortality in future outbreaks.
Acknowledgments
This article was developed for the “Write a Data Science Blog Post”, my first project for the Udacity Data Science Nanodegree Program. I would like to thank Udacity for encouraging me to develop this work, my family for giving me the support I need to study, and my professor and friend Rodrigo Veloso for his guidance.
Juliano Oliveira
Data Source
- Coronavirus (COVID-19) Deaths (Our World in Data): https://ourworldindata.org/covid-deaths/
- Gross Domestic Product — GDP (The World Bank): https://data.worldbank.org/indicator/NY.GDP.MKTP.CD
- Corruption Perception Index 2020 (Transparency International): https://www.transparency.org/en/cpi/2020/index/bra
- Education Index HDR 2019 (United Nations Development Programme): http://hdr.undp.org/en/indicators/103706
- The 2021 STC Health Index (Hudson’s Global Residence Index): https://globalresidenceindex.com/hnwi-index/health-index/
- Democracy Index 2020 (The Economist Intelligence Unit): https://www.eiu.com/n/campaigns/democracy-index-2020/
GitHub


